
The numbers are open. Every trade accounted for.
148+
Verified backtest trades executed across all active strategies since inception.
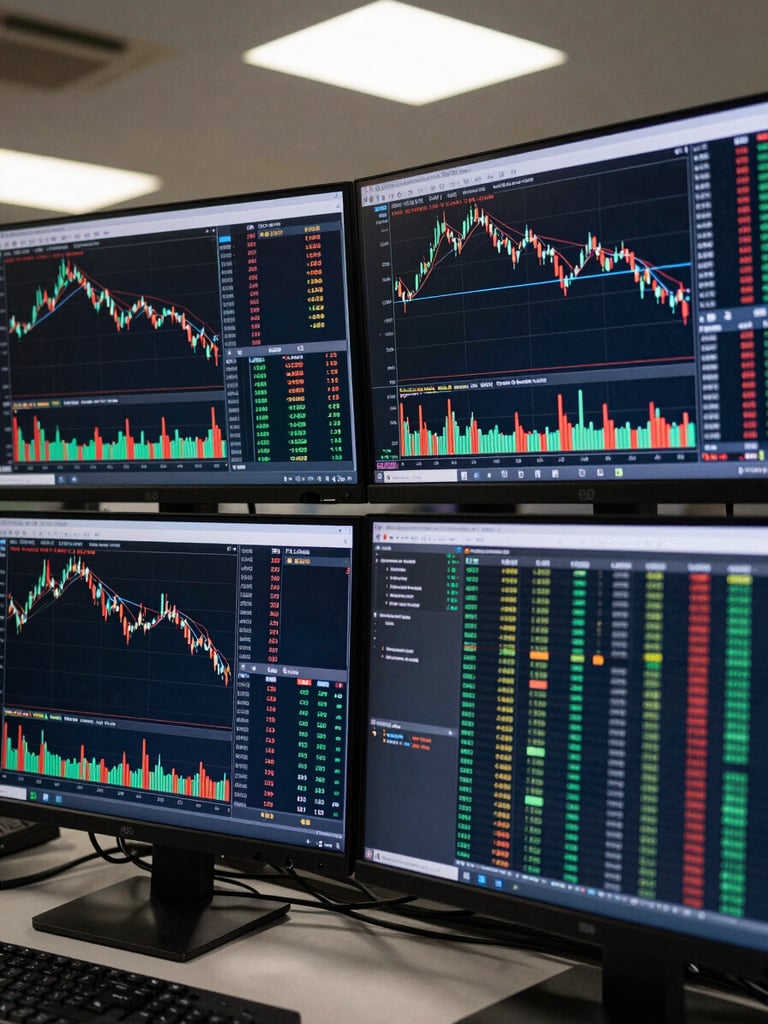
Live backtesting statistics across Forex, Futures, Gold, and major indices—reported with full methodology disclosure, not curated equity curves.

Updated continuously. No cherry-picking.
Every strategy reports net return, win rate, and trade count in real time. Figures below represent the most recent 12-month rolling window across all active instruments.
Forex — EUR/USD, GBP/USD, USD/JPY
Futures — ES, NQ, CL
Gold (XAU/USD) and Global Indices
Net return 38.4% / Win rate 67.2% / 4,210 trades / Max drawdown 6.1%
Net return 44.1% / Win rate 61.8% / 3,570 trades / Max drawdown 7.9%
Net return 51.7% / Win rate 63.5% / 2,980 trades / Max drawdown 8.4%
2.41 avg
3.4% peak
5.2x ratio
Net profit divided by max drawdown—measures how efficiently the system recovers losses relative to what it earns.
Risk-adjusted return per unit of volatility, averaged across all active strategies.
Worst observed peak-to-trough equity decline across all instruments in the reporting window.
Testing parameters applied to all strategies
Verified by a third party. No exceptions.
10-year historical dataset minimum / Realistic bid-ask spread modelling / Commission and swap costs included / No curve-fitting on in-sample data / Walk-forward window: 6 months out-of-sample
Instruments with active verified reporting
Every backtesting dataset is submitted to an independent auditor before publication. Walk-forward validation, out-of-sample testing, and slippage assumptions are disclosed in full alongside each result.
EUR/USD, GBP/USD, USD/JPY, AUD/USD / E-mini S&P 500, Nasdaq 100, Crude Oil / XAU/USD Gold / DAX 40, FTSE 100, Nikkei 225
Built around protection. Optimized for performance.
The data is open. The methodology is disclosed. The next step is selecting the plan that fits your instruments and capital allocation.