

Algorithmic execution. Hardcoded capital preservation.
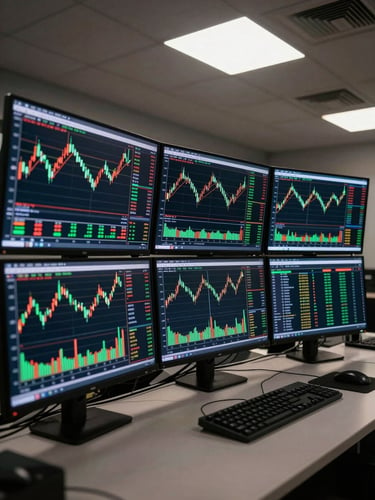
Every bot in the Strat-X lineup executes Forex, Futures, Gold, and index trades automatically—drawdown limits and position-sizing rules baked in at the code level, not layered on afterward.
Systems built for measured risk
+187% annualised — Forex EA Suite
3.2% max drawdown — Gold & Futures EA
78% signal accuracy — TradingView Suite
Precision execution on XAU/USD, US30, NAS100, and key futures contracts. Capital-preservation thresholds enforced at the broker API level—no manual override required.
Data-driven entry and exit signals for semi-automated traders. Indicator logic is the same engine powering the full EAs—deployed as Pine Script for direct TradingView integration.
MT4/5 expert advisors covering major and minor pairs. Entries and exits governed by multi-timeframe momentum logic with hardcoded 4% max drawdown per session.

Published because the numbers hold up
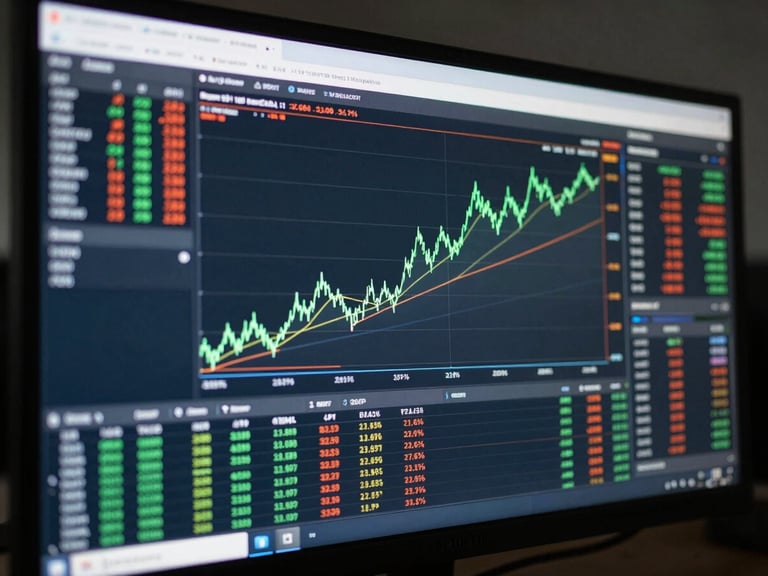
Every backtesting dataset is third-party audited and available unredacted. Tick data from 2018 onward. Slippage and commission modeled at live broker rates—not theoretical spreads.
Sharpe ratios, monthly drawdown curves, and trade-by-trade logs are accessible from the Performance page before any purchase decision is made.
Evaluate the data. Then choose a plan.
Review independently verified backtesting statistics first. When the numbers satisfy your criteria, subscription options are a single click away.